App Commerce Peak Trading Report

Download the Peak Trading Report here.
The way we shop is constantly evolving and peak trading is no different. Sales have expanded from Cyber Weekend to Cyber Week in 2015 and 2016 and widened even further to Cyber Fortnight in 2017, with some calling for the whole month of November to be dubbed ‘Black month’. As the frenzy of Black Friday expands, it’s important to know how shoppers are behaving and what shifts in shopping behaviour can mean for retailers.
In order to build more relevant research and recommendations, we have examined desktop, mobile websites and both Android and iOS apps with a focus on Q4 2017, together with data from the previous two years for retrospective comparison. We examined over 30m sessions across Q4 2017 and over 6.5m in cyber fortnight alone.
November overtakes December as the biggest month of the year
- Q4 accounted for a third of total app revenue in 2017, and November app revenues grew 134% year-over-year
Increased engagement leads to an app spending spike
- Shoppers spent on average 3.6x more in shopping apps than mobile websites
- App downloads on Black Friday were 2.6x the average day in 2017
Big shopping days drive a step change in app audience
- The volume of downloads and active app users spike in Q4 and plateaus at this higher level, proving the lasting impact of peak trading and contribution of the app channel
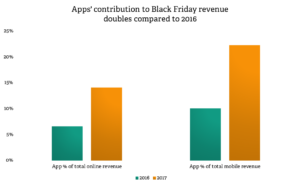
- In 2017 clients on the Poq platform saw apps’ contribution to online and mobile revenue double compared to 2016. On average app revenue as a percentage of mobile grew 2.2x to account for 22% of mobile revenue on Black Friday